The Dow Theory is one of the most popularly used concepts of charting & Technical Analysis. It happens to be one of the oldest technical analysis tools as well. Dow Theory days back to as early as 1900 to 1902 when Charles Dow laid the basic principles. The Theory named after him as Dow Theory. It helps investors in the stock market to understand the health of the trade condition. The father of Dow Theory, Mr Charles Dow died in 1902 but after his death work of Dow Theory was continued by William Hamilton.
The Dow Theory helps investors to know how the stock market used to understand the business environment’s health. It was the first theory of technical analysis that explains the trends of market moves.
Principles of Dow Theory:
There are six assumptions of the Dow Theory for studying by investors and analysts of the stock market.
Market Discounts Everything
This assumption of Dow Theory proposes that stock price reflects everything including all information past, current, and even future. This contains all data including sentiments of investors, profit announcements by companies, even rise or fall inflation. This Theory also works for events of an unpredictable account by which stock prices determine such as earthquakes and other natural disasters. This is also known as the Efficient Market Hypothesis.
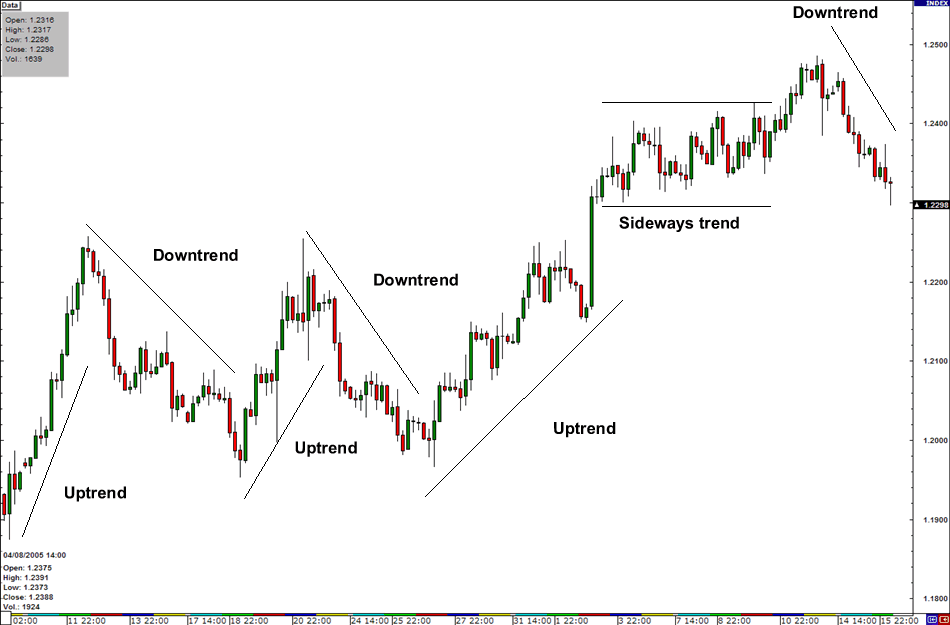
Market Trends are of three types
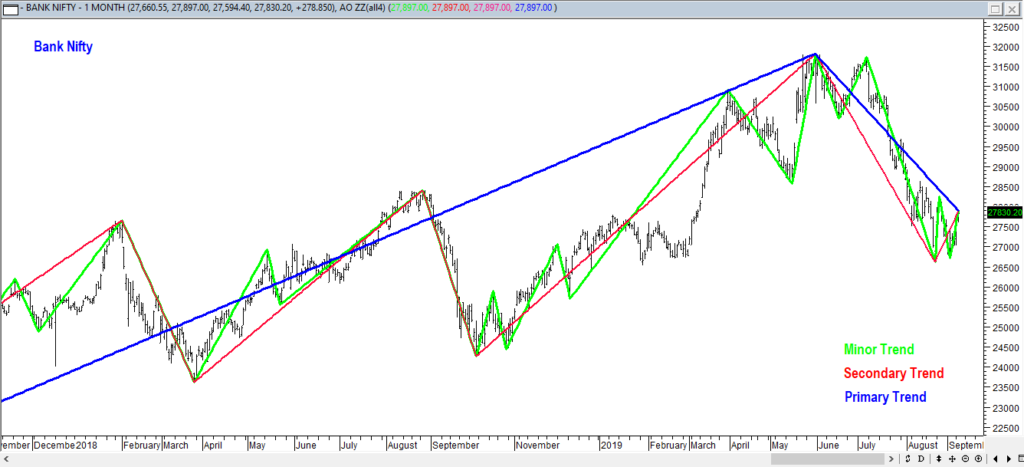
The primary, secondary and minor trends that affect the stock market
- Primary Trend: The primary trend is one of the major trends for the market, which indicates how the market moves in the long-term. It can occur in both rising and falling market.
- Secondary Trend: It is considered for correction to a primary trend. It’s an opposite action to the primary trend. This secondary trend has a range of 10 days to three months.
- Minor Trend: In this trend, the market movement fluctuated on a daily basis. And these trends last usually less than three weeks. Minor trends are short term trends.
The market has three phases
These three phases in the market are accumulation, public participation, and distribution or panic phase.
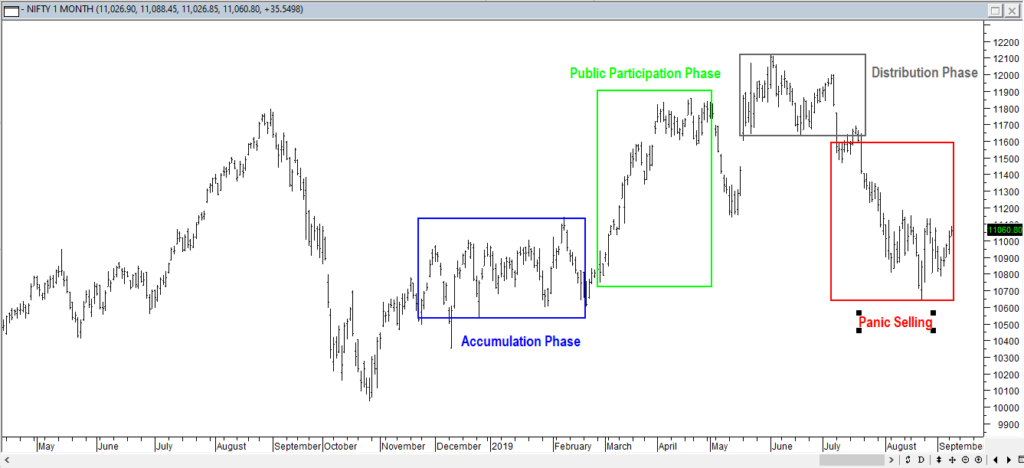
In bullish markets, the phases described as below
- Accumulation Phase: The accumulation market phase is when investors feel the change in the current market direction when they are entering the market.
- Public Participation Phase: In this phase, investors enter the market just when the condition of the market improves and positive sentiments become noticeable.
- Distribution or Panic Phase: This phase begins when the entire bullish news headline is carried by media, there is buying on huge volume which is base on speculation. During the distribution phase, the trade news is bullish than ever, business value begins to advance quickly, & the community flock to the market in expectation of catching the movements.
Now talk about the bear market phases:
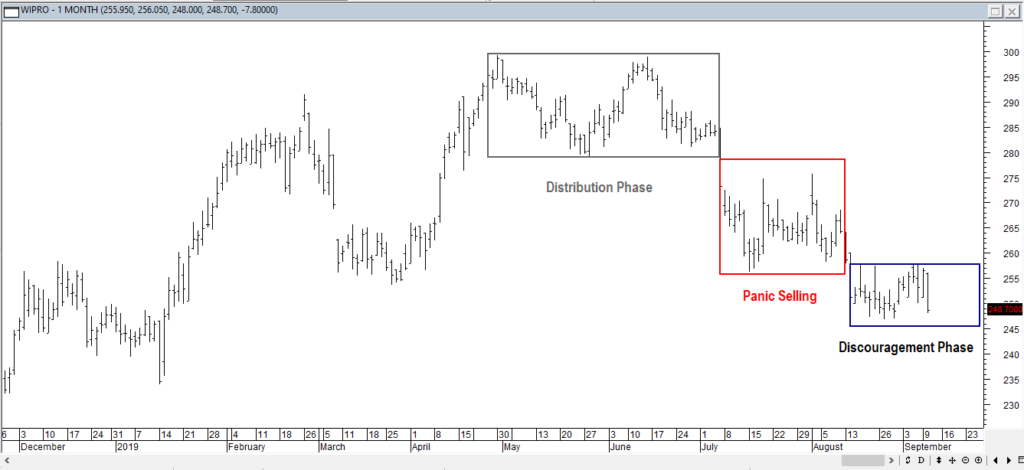
- Distribution Phase: Usually the bear market starts when the bull market going to end.
- Panic selling phase is: According to the name – best described by panic & fear. As a market price begins to failure and buyers become limited, people want to leave the market urgently when the very sharp drop occurs in the price of the market.
- Discouragement phase: It occurs when the sharpest failures are finish. Stock investors thought that the market would improve, sell their portfolios which discouraged by the condition. This phase may follow through a lengthy horizontal range, but after some time (sooner or later) things start to look positive and a new accumulation phase occurs in the market.
The Stock Market Averages must confirm each other
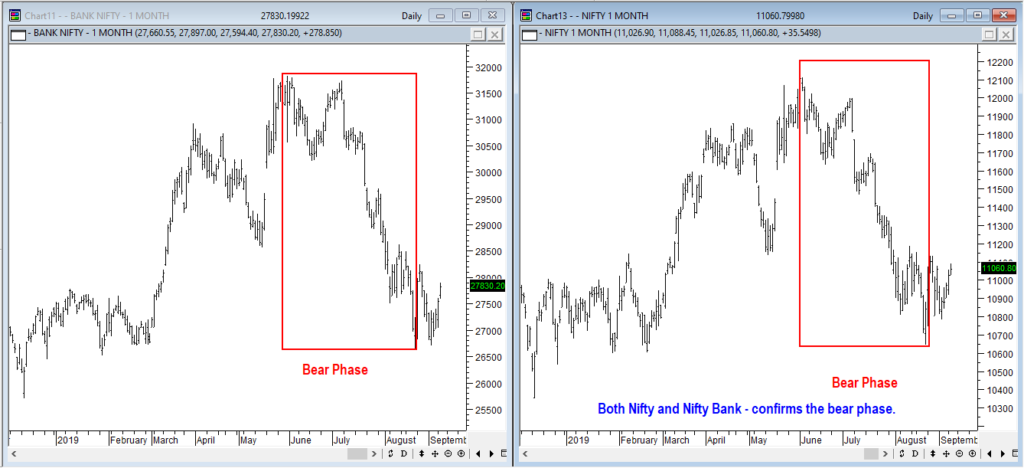
Stock market averages must be in sync with each other. Companies operating across various different industries affect each other business in one way or the other. The key averages and stats of these industries, hence, get impacted by each other too. For example, a manufacturing company may manufacture goods but for transporting them to the end-user it will be using the transportation industry. So if the sales or profits or any particular averages in manufacturing goes up, then in ideal conditions even the transportation industry average should also go up, considering all other factors remain the same. The Dow Theory states that the averages across industry confirm each other trends to some extent as well.
Trends are confirmed by volume
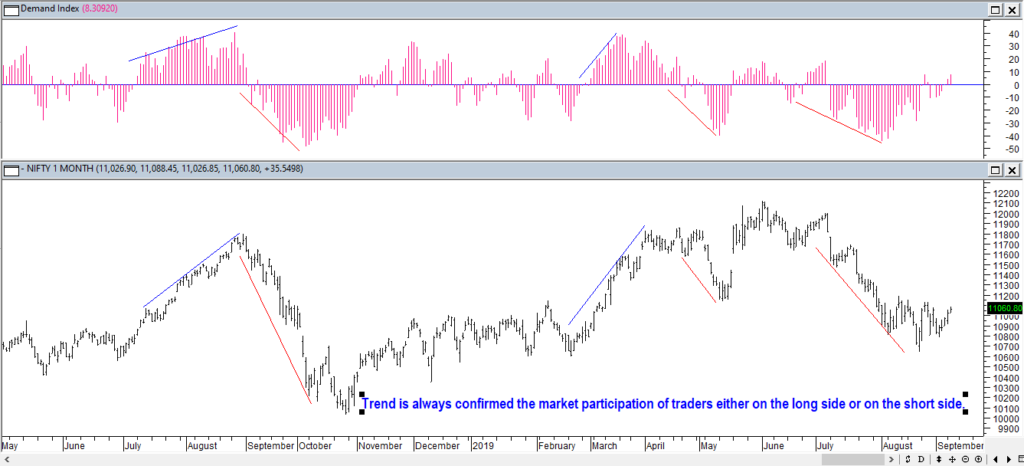
According to Dow Theory volume is a secondary factor but it’s important. Volume increases or decreases when price movement occurs in the trend direction or in reverse. If the price is moving in the direction of the primary trend then the volume should increase otherwise it will decrease if it is moving against the primary trend. Low volume indicates a weakness in the trend. Such as, in a bull market, if the price is rising then volume should increase, and fall if secondary pullback occurs.
Trends keep going until a clear reversal occurs
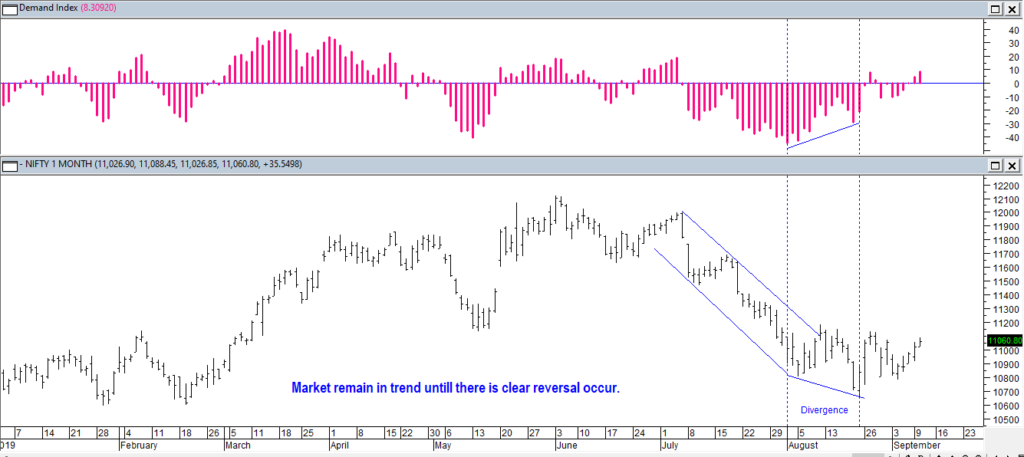
Primary trend reversals can be confused with the secondary trend. According to Dow Theory, a trend keeps moving in the direction until some other external forces occur for changing the direction.
However, the Dow Theory is relevant in nature of the Technical Analysis, it also has some criticism, which are as follows:
- It’s not really a theory: The Dow Theory has no proper papers of academic research. It has written as the theory and testing formulas. In the Wall Street Journal, the Dow ideas were in the fourth position over his column.
- Being Too Late: The market trend does not covert from bearish to bullish until the previous reaction high has been exceeded. Some traders thoughts that Dow is simply too late and errors occur in most of the moves.
- Outdated: Many market traders feel that the Dow Theory is no longer available to give an exact economy reflection. IT, Pharmaceuticals and some other sectors have robust stock market participation.
Alternative for Secondary Market
The markets may stay sideways (exchanging between a range) for a prolonged period. For instance: The Reliance Company was trading somewhere in the range of 860 and 990 for the period of 2010 and 2013. The sideways markets can be seen as an optional pattern in the secondary trend. Thus, for Short term investors, it becomes crucial to diversify their investment portfolio as to minimise their losses during
sideways trend.
Importance of Closing Price
Amongst the open, high, low and close price values, the most significant price level is said to be the Closing Price as it depicts the last assessment of the stock during the day which enables the traders to deal in stocks with accurate information about the current market.
Patterns of Dow Theory
The Investors/Dealers can use the below-mentioned patterns to pick out good options for buying and selling in the market.
- The Double bottom & Double top formation
- The Triple Bottom & Triple Top
- Range formation, and
- Flag formation
Significance of Dow Theory Principles
The conduct of the Dow Jones Industrial Average (DJIA) usually grabs the attention in the market. But only few investors knows about the fundamentals of theory. By comprehending the principles of the Theory, dealers will be in a higher position to identify hidden tendencies that the qualified skilled traders might be taking note of it which enables them to make sound choices to achieve the goal of having best capital formation.
Conclusion
Basically, Dow Theory represents Technical Analysis beginning. By understanding this theory you can get a better understanding of an analyst view of how the markets work. The main goal of the Dow Theory is to recognize the primary trend of the market. It is useful for identification of trend and it’s also useful for signals of entry & exit. The Dow Theory describes the stock market behaviour. Moreover, professional Traders and investors use to all trades on a stock exchange. This is not a theory which used to produce perfect signals to buy and sell. it provides basic ideas and rules about the market functioning. It helpful, in the overall understanding of how it works.
Besides, some ideas are still usable as they were before 100 years, and currently, the effect of Dow Theory (Divergence, trend definition, concepts which used to construct indicators of stocks, etc.) is clearly visible on Technical Analysis. Dow Theory is an essential part of the Technical Analysis. Traders and investors use it when they do various technical charting, use technical indicators and perform technical analysis.