Technical analysis is a popular approach of analysing financial markets that entails evaluating past price and volume data to detect trends and patterns that can help traders make informed decisions.
The study of market movement, primarily through the use of charts, in order to forecast future price trends is known as technical analysis. It considers that all essential information about a security is captured in its past price and volume data, and it aims to uncover patterns or trends that can help anticipate future price movements.
The purpose of technical analysis is to identify regions of support and resistance, as well as trendlines and other patterns that can be utilised to identify probable entry and exit locations for trades. Technical analysis is frequently used in conjunction with other kinds of analysis, such as fundamental analysis, to construct a comprehensive trading strategy.
There are several essential concepts that serve as the cornerstone of technical analysis, including:
Trends: The concept of a trend is one of the most fundamental in technical analysis. A trend is the general direction in which a security moves over time. Trends can be classed as bullish (upward), bearish (downward), or sideways (horizontal).
Support and resistance: A price level at which buying pressure is predicted to be strong enough to prevent the price from falling further is referred to be a support level. A price level at which selling pressure is projected to be strong enough to prevent the price from increasing further is referred to be resistance.
Indicators are mathematical computations that are based on price and/or volume data and can be used to corroborate or contradict other signals. Moving averages, the relative strength index (RSI), and the stochastic oscillator are all common indicators.
Chart patterns are recurrent formations on the chart that can be used to identify future trend reversals or continuations. Head and shoulders, double tops and bottoms, and triangles are all common chart patterns.
Types of Chart pattern
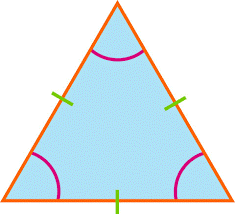
Triangle Chart Pattern
Triangle patterns are so named because the upper and lower trendlines eventually intersect at the peak on the right side to form a corner. The triangle’s other two corners are constructed by connecting the top and bottom trendlines. The lows are utilised to form the lower trendline, while the highs are used to build the upper trendline
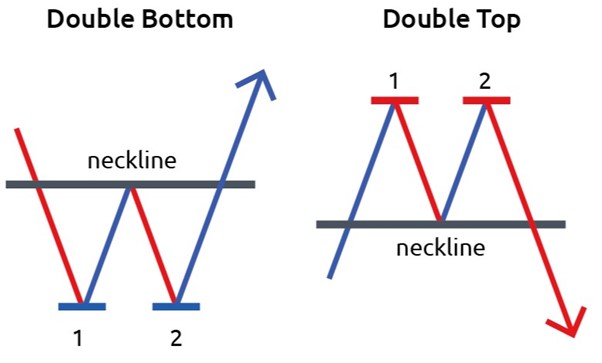
Double top and double bottom patterns
Double top and bottom patterns emerge when the underlying investment moves in a pattern similar to the letters “W” (double bottom) or “M” (double top). Double top and bottom analysis is used in technical analysis to explain movements in a securities or other investment, and it can be employed as part of a trading strategy to exploit repeated patterns.
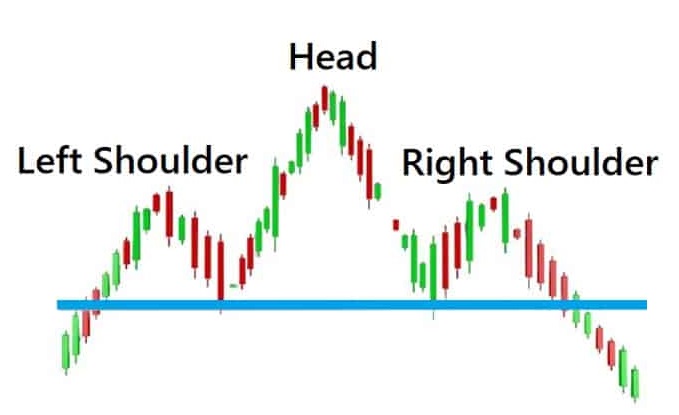
Head and shoulders
On a technical analysis chart, the head and shoulders formation happen when a market trend is in the midst of reversing, either from a bullish or bearish trend; a characteristic pattern forms and is recognised as reversal formation
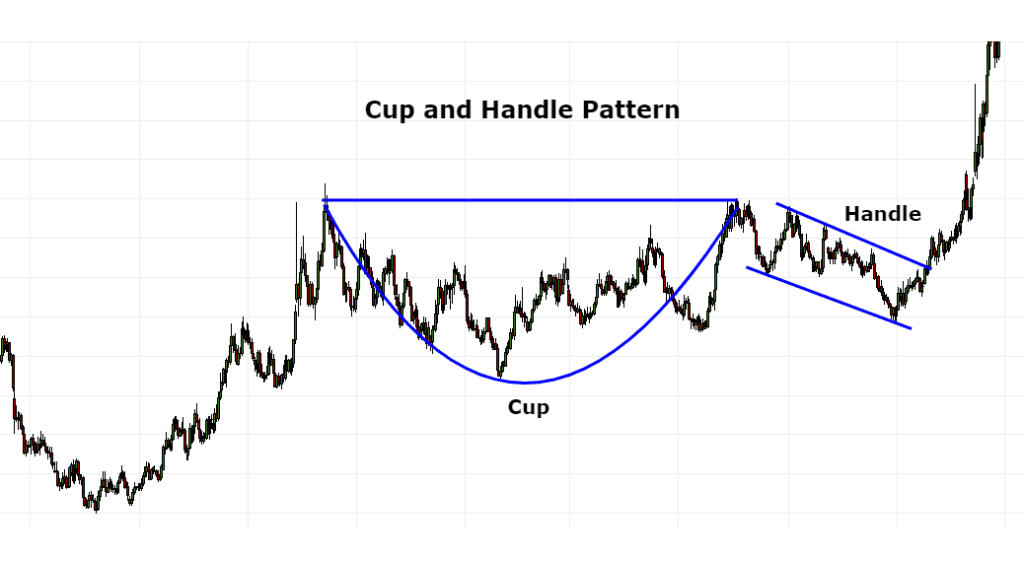
Cup and handle
A cup and handle is a technical chart pattern that looks like a cup and handle, but the cup is shaped like a “u” and the handle has a tiny downward drift. When using this indicator, technical traders should set a stop buy order slightly above the upper trendline of the pattern’s handle.
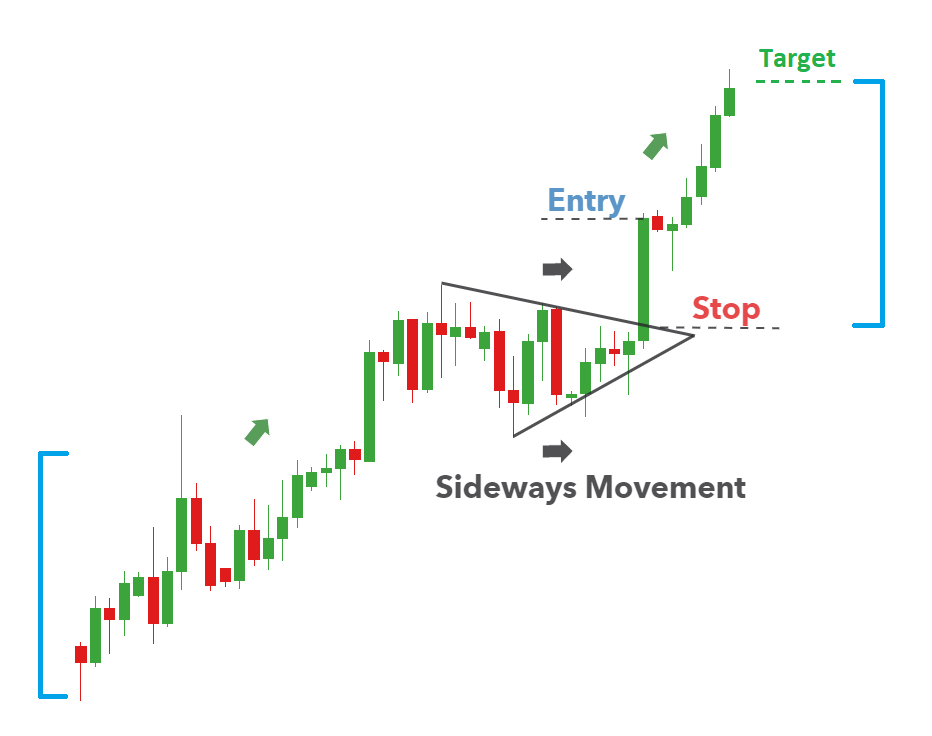
Flag and pennant patterns
Flag and pennant patterns are commonly seen in price charts of financial instruments (stocks, bonds, futures, and so on). The patterns are characterised by a clear price trend direction, followed by consolidation and rangebound movement, and finally trend continuance. They are continuation patterns that form when asset prices dramatically rise or fall.
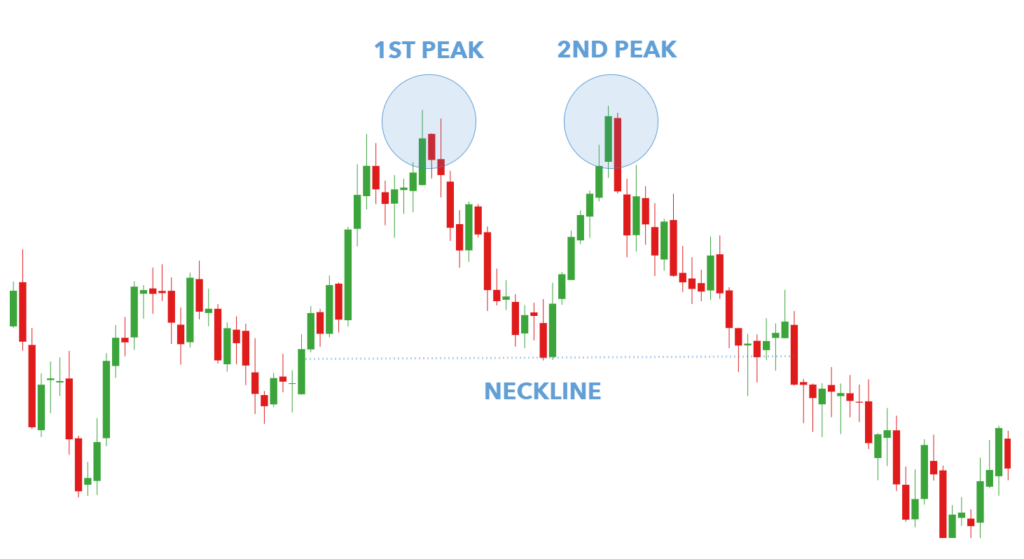
Double Top Pattern
A double top pattern is an exceedingly negative technical reversal pattern that arises when an asset reaches a high price twice in a row with a moderate fall between the two highs. It is confirmed when the asset’s price falls below a support level equal to the low between the two prior highs
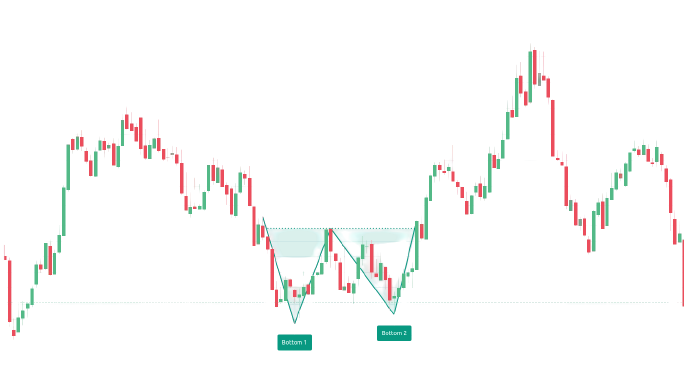
Double bottom pattern
A double bottom pattern is a classic technical analysis charting shape that shows a significant change in trend from a previous down move. The double bottom motif resembles the letter “W.” The twice-touched low is regarded as a support level.
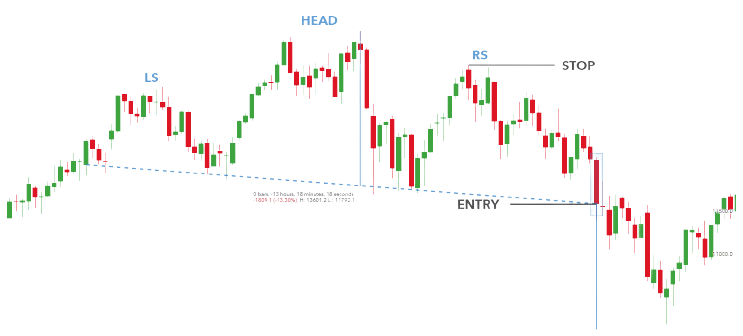
Head and shoulders chart pattern
A common and easy-to-spot pattern in technical analysis, the head and shoulders chart pattern depicts a baseline with three peaks, the middle peak being the highest. The head and shoulders chart suggests a bullish-to-bearish trend reversal and the end of an upward trend.