Gann Theory or the Gann Angles is one of the most powerful methods used by traders to predict price and pattern change in the stock market. This was formulated by American trader and market theorist William Delbert Gann in 1935. And is still being used by traders and analysts to predict the behaviour of the market.
The Gann takes into account the past, present and the future of the markets all in the Gann angle. Which has been successfully used over the years to foresee the emerging trends in the market. Analysts who use this formula to predict the behaviour of the market look into the historical perspective of the market, from where it started and how does it stand in relation to its performance in the past.
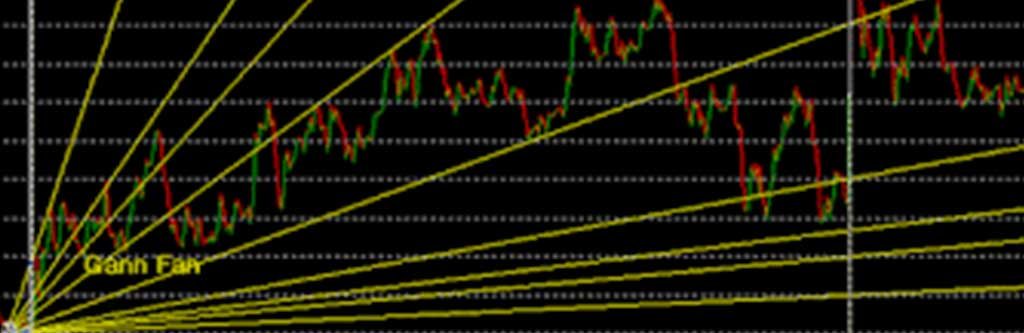
The Gann Angles
The Gann hypothesis predicts the price value developments with the assistance of
sequence of angles. It signifies the past, current and future traits of
a stock price. The Angles are drawn at distinctive price levels. Actually, the
estimation of Gann angles is done in the wake of interfacing the price levels on the
diagrams.
Making of The Angle:
The basic theory behind these geometric angles lies in plotting the time (hour, day and week) and price of stocks in simple graph. This Gann theory stated that definite geometric patterns and angles behaved uniquely and these could be used to predict price action. In this technique the equal time and price intervals in the movement of the stock (i.e. 1×1) would be equal a 45 degree angle relative to the time axis.
Degree Chart
- 1 x 8 – 82.5 degrees
- 1 x 4 – 75 degrees
- 1 x 3 – 71.25 degrees
- 1 x 2 – 63.75 degrees
- 1 x 1 – 45 degrees
- 2 x 1 – 26.25 degrees
- 3 x 1 – 18.75 degrees
- 4 x 1 – 15 degrees
- 8 x 1 – 7.5 degrees
The above angles would exactly match the degrees when the x and the y axis are spaced equally. In the above degree the up-trend is signified by anything above the 1×1 angle with this equilibrium offering major support to the stocks. The reversal is signified when the angle drops below the 1×1 mark and goes in for a reversal. According to Gann in a bull market the 1×1 would have priced above the trend line while in a bear market the prices would be below the trend line. The 1×1 trend line would see a major support during an up-trend in the stocks and when it peaks and the trend line broken there would be a reversal of trends.
Application of Gann Theory:
The Gann Theory can broadly be used to study three types of patterns and predict market behaviour in the future.
-
Price Study
The Gann Angle allows us to study the patterns in price. The theory relies on support and resistance lines, pivot points and angle to predict the changes in the price patterns of stocks in the market.
-
Time Study
Using the time study model in this theory accurate prediction can be made about the time when the stocks reverse the trend. In this study historically reoccurring dates are derived from natural and this according to Gann often governs the fate of the markets.
-
Pattern Study
The last on the list is the study of the trends and patterns which sort the reversal trends in the market. And can used to gauge the mood of the investors surrounding the markets and particular stocks.
Gann Theory Principles
- Trading Stocks over the 1×1 Gann edge (45 degrees) are in a solid upswing. Thus, trading
the stock just from the long side. - Stocks trading underneath the 1×1 Gann point (45 degrees) are in a solid downtrend.
Trading should only happen in the short side. - In the event on Friday if any stock instrument, accomplishes its most significant price,
anticipate that the bullish force should proceed in the following week too. - In the event that on Friday if any stock instrument accomplishes it’s most minimal price,
anticipate that the bearish trend should proceed in the following week too. - If an adjustment is larger in size with regard to time & price than its past revision, it shows
that the new pattern is evolving. - Tuesdays frequently mark the week by week lows when the market is in a robust upward
trend. - The half retracement level of the past increase or decrease is a significant level to go into
another position. - At the point when price levels ruptures the highs of the recent last 4 weeks, it shows
further more significant rise in price levels ahead. - In the event that price levels crosses the high throughout the previous 3 days, the fourth
day would see even greater price levels. - At the point when price value ruptures the lows of the recent last 4 weeks, it
demonstrates further lower price levels ahead. - A five day consistent development in price levels will be rectified within 3 days.
- A nine day consistent development in price levels will be rectified within 5 days.
- Always allocate or diversify your investments in different assets having negative or no
correlation amongst them so as to minimise the risk and increase the portfolio returns.